Validators Monitoring
Prerequisites
First install Grafana and Prometheus on your machine.
Enable tendermint metrics
To enable metrics, you'll have to make an adjustment in the node's config.toml
file by setting the prometheus option to true:
sed -i 's/prometheus = false/prometheus = true/g' /home/zetachain/.zetacored/config/config.toml
To apply the modification, it's necessary to restart the node. You should then
have the capability to reach the tendermint metrics, which are set as the
default on port port 26660: http://localhost:26660
Configure prometheus targets
Locate the prometheus.yml file and add the following job entry under the
scrape_configs section:
- job_name: "zetachain"
  static_configs:
    - targets: ["localhost:26660"]
      labels:
        instance: "validator"
On Linux machines, you can typically find the prometheus.yml file at the
following path: /etc/prometheus/prometheus.yml
Reload Prometheus and Restart Zetachain
Reload Prometheus configuration:
curl -X POST http://localhost:9090/-/reload
Restart Zetachain Node:
sudo systemctl restart zetacored
Configure Grafana
By default, Grafana usually runs on port 3000. You can access Grafana by
navigating to the following URL: http://localhost:3000.
The default username and password is admin.
Add your Prometheus Data Source:
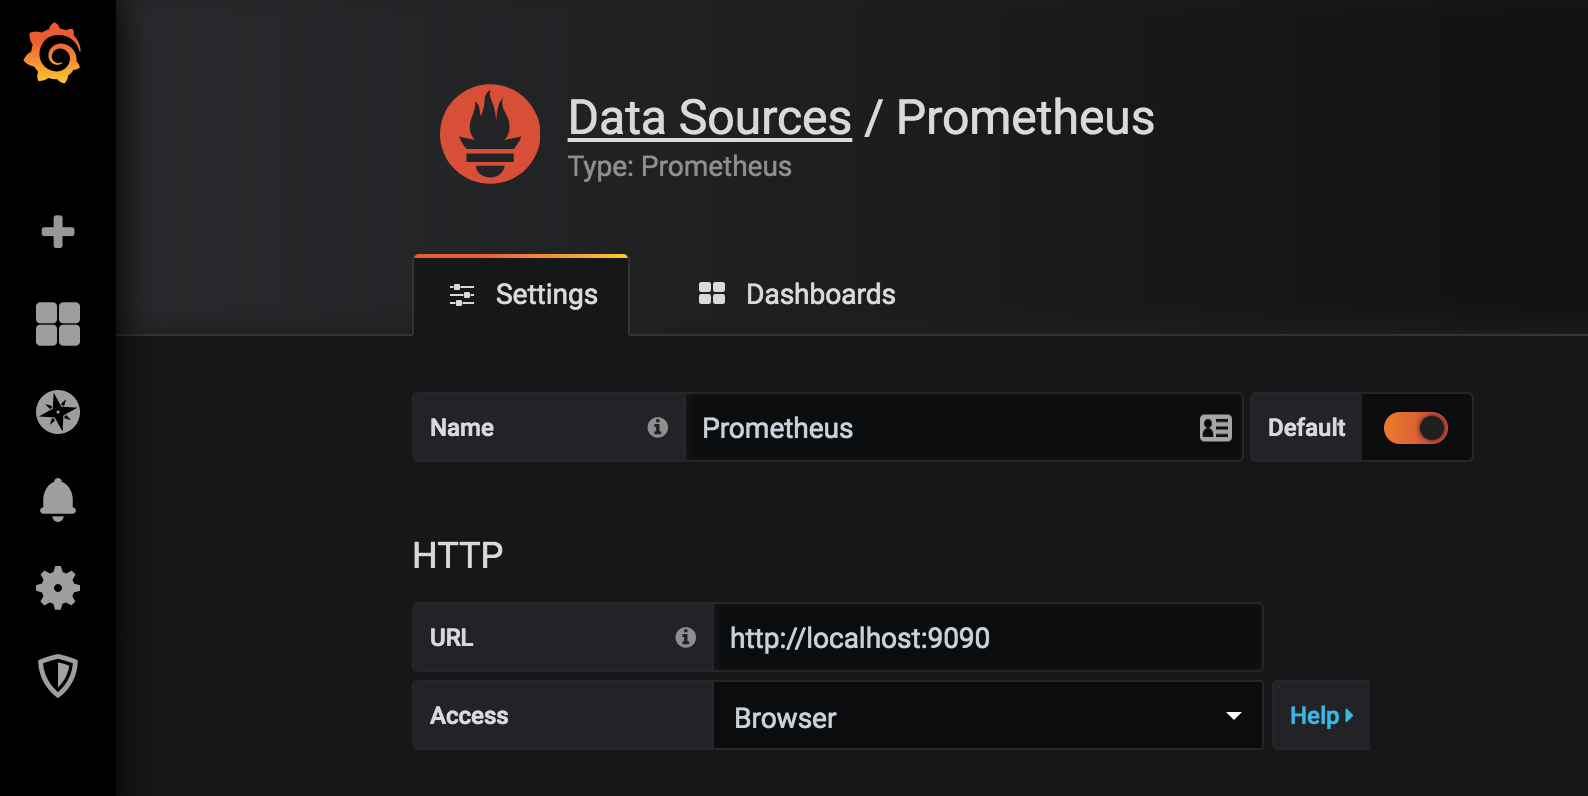
Click on Save & test to test the configuration, if everything is alright
you'll see the green message Data source is working.
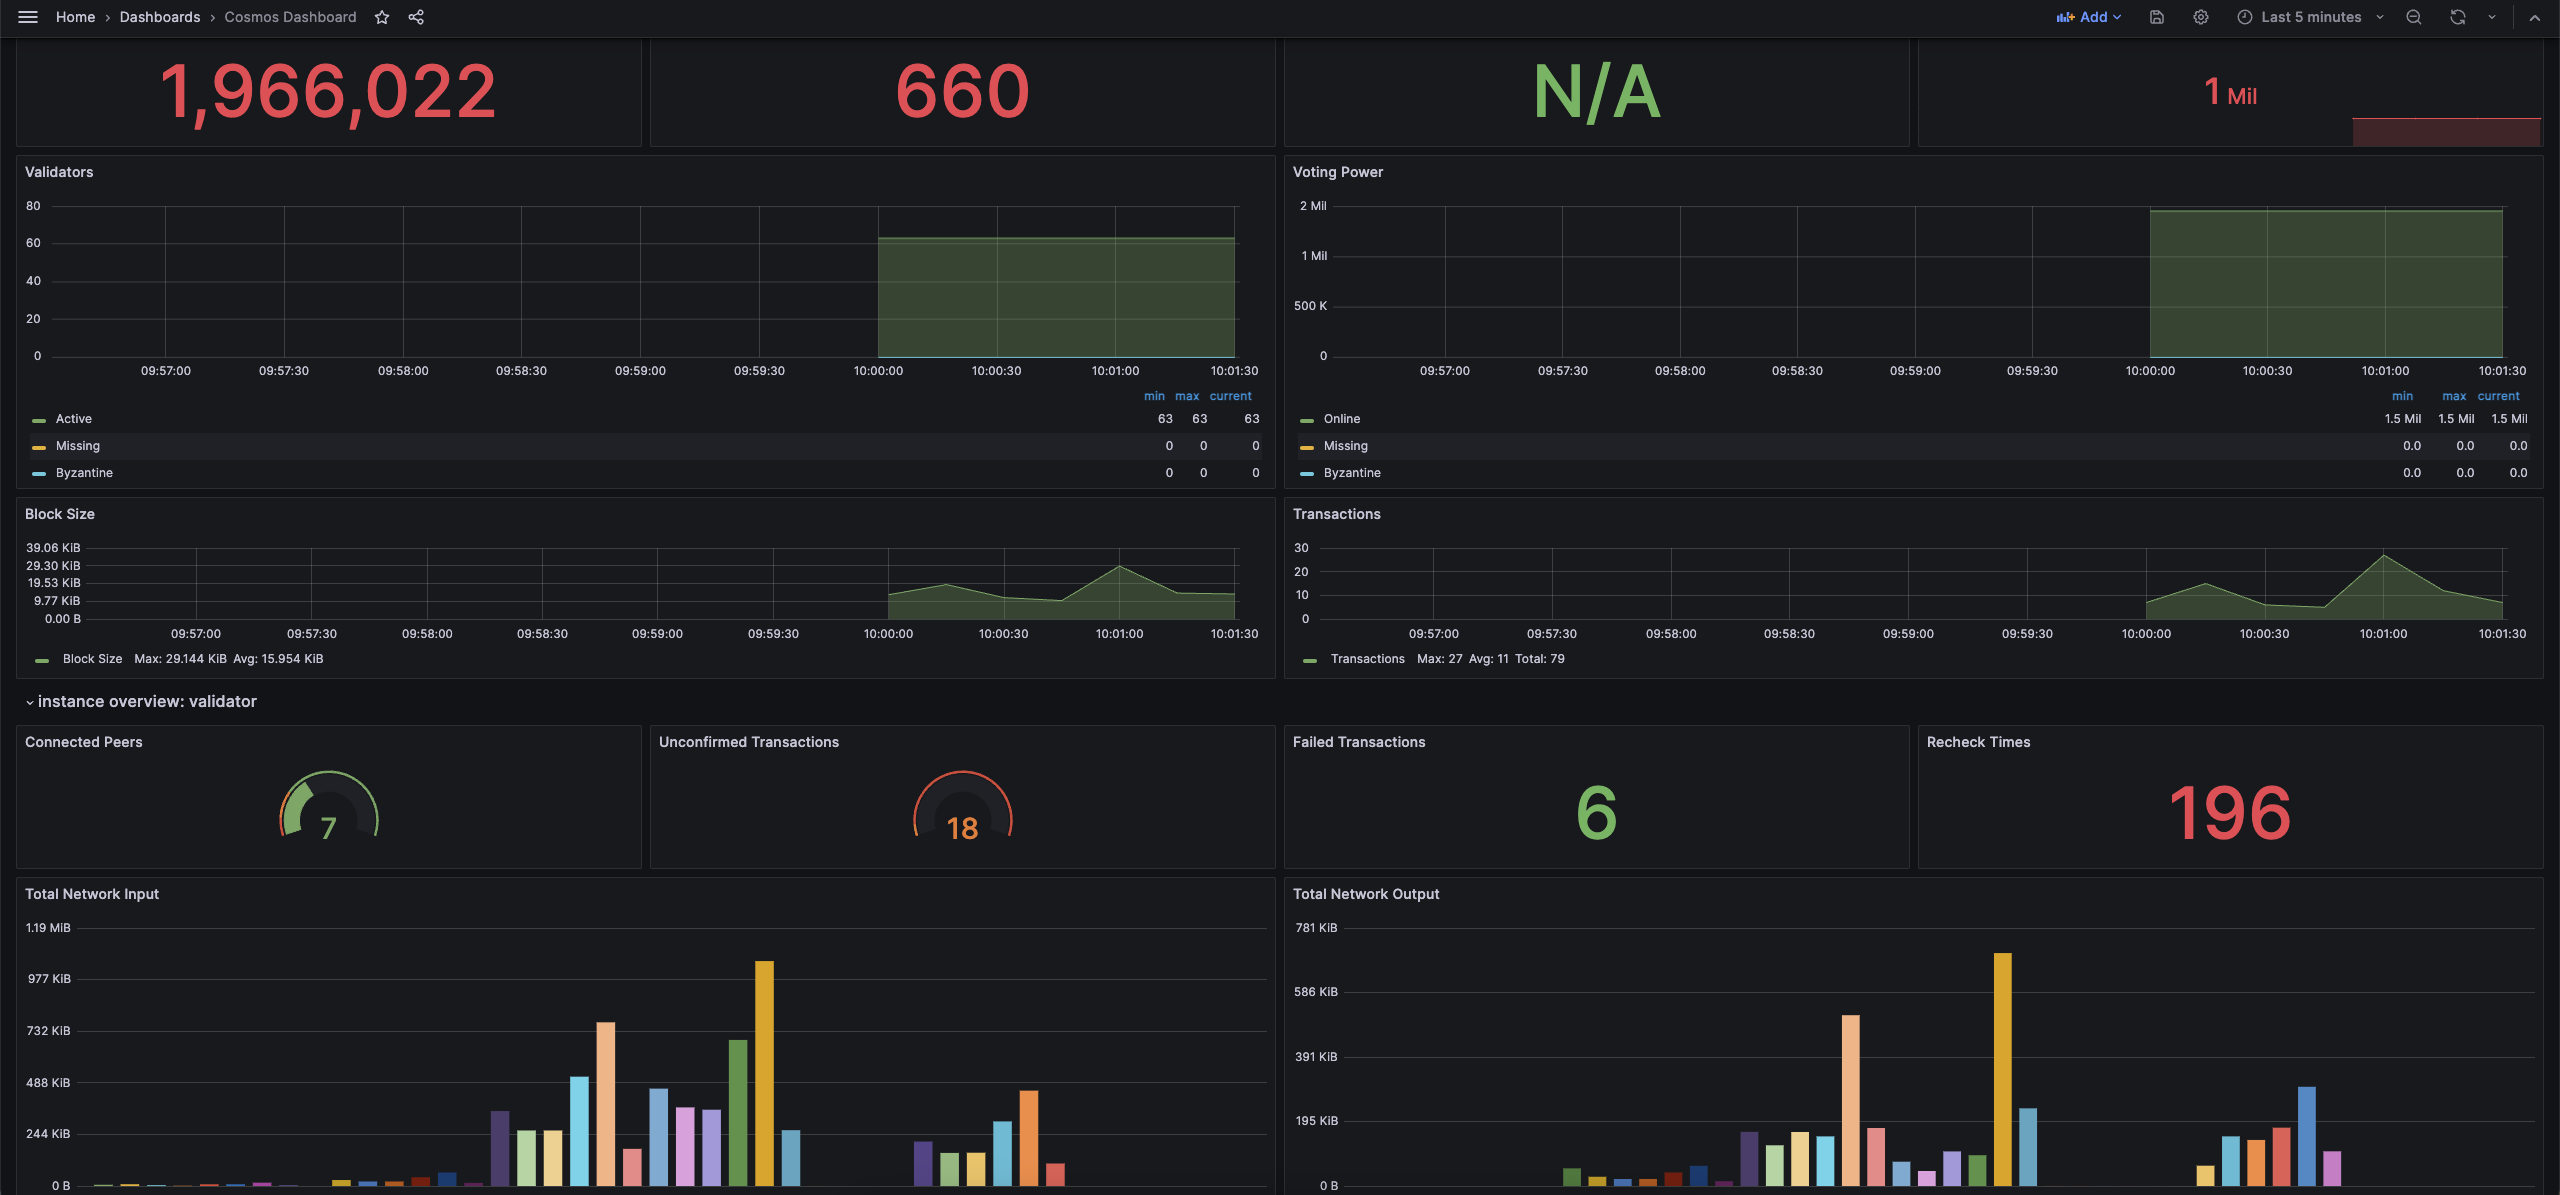
Import grafana dashboard
Copy and paste the
Grafana Dashboard ID 11036 and
click on Load to complete importing.
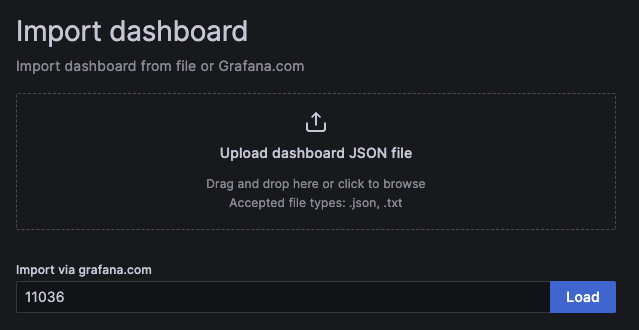
Select your Prometheus as Data Source and click Import.
At this point, you should be able to monitor your validator node.