The best model is not the most-used model
Anuma is the only consumer AI product where one private memory spans more than 30 models. That makes the network a measurement instrument: what people actually use when switching costs nothing. This report crosses that revealed preference with public benchmark data. Every internal number comes from the Anuma application database, aggregates only: the network cannot see message content by design.
The intelligence-usage gap
Artificial Analysis scores Claude Opus 5 highest on its Intelligence Index at 63. On this network, Claude Opus 5 served 0.06 percent of consumer requests in this edition’s 90-day window, ending August 17, 2026. The model consumers actually live in, gpt-5.6-luna, scores 47, mid-table, and served 15.3 percent of all requests in that window, rising to 43.8 percent in its closing week. Across every model with a published score, benchmark rank explains almost none of the variance in consumer usage.
The obvious objection is that this is the router’s doing, since most traffic is auto-routed. Switch the view: the gap survives. Among the roughly 15 percent of messages where people picked a model by hand, grok-4.3, near the bottom of the scored set at 37, is the largest deliberate pick. Claude Opus 5, the leaderboard’s best, drew 1 percent of hand picks. And deliberate choice is radically flatter than routed traffic: the single most-picked model takes about a sixth of hand choices while more than 30 models split the rest. People do not converge on the best model. They diversify.
The gap is not ignorance. It is what optimization looks like: fast, cheap-enough, good-enough models win everyday conversation, and frontier intelligence gets summoned for the moments that need it. Leaderboards measure what models can do. A memory layer measures what people keep coming back to. Those are different questions with different winners.
Developers are not consumers
The same divergence shows up against the developer market. On OpenRouter, where developers route API traffic, the DeepSeek family alone carries roughly 38 percent of top-10 weekly tokens and Claude Opus 5 holds a real 5.4 percent share; on this network, consumers barely touch either. The two markets agree on exactly one model, gpt-5.6-luna, and disagree everywhere else: developers concentrate in cheap open-weight workhorses for pipelines and pay up for frontier intelligence where it compounds, while consumers live in conversational defaults. Anyone modeling AI demand from developer data alone is measuring a different market.
The Delegation Rate
84.8% of messages in the last 30 days let the network route the model choice automatically. This is the number that explains the scatter above: consumer AI is becoming a delegated market, where the router’s preferences are the market’s preferences. Users state the intent; the network picks the tool. We track this as a standing index because its direction matters more than its level: every point of delegation moves model selection power from brand marketing to routing infrastructure.
The Switching Rate
Of the 26,342 people active in the last 30 days, 41.6% had their memory serve two or more models, 21.3% three or more, and 5.0% five or more. The average memory spanned 1.85 models in a single month. Some of that diversity is the router at work, which is the point: when context follows the person instead of the platform, the cost of trying another model falls to zero, and usage spreads to wherever the work is best done.
The open-weight cycle
Open-weight models (the GLM, Kimi, Qwen, DeepSeek, MiniMax, and gpt-oss families) served between 14 and 57 percent of monthly requests this year, and the swings tell the real story: open share compresses when a strong frontier default ships and expands in the gaps between frontier cycles, absorbing the traffic that closed launches temporarily capture. In August, open-weight models served 30.2% of all requests. Neither side of the open-versus-closed debate is winning; consumers are arbitraging both.
Network appendix
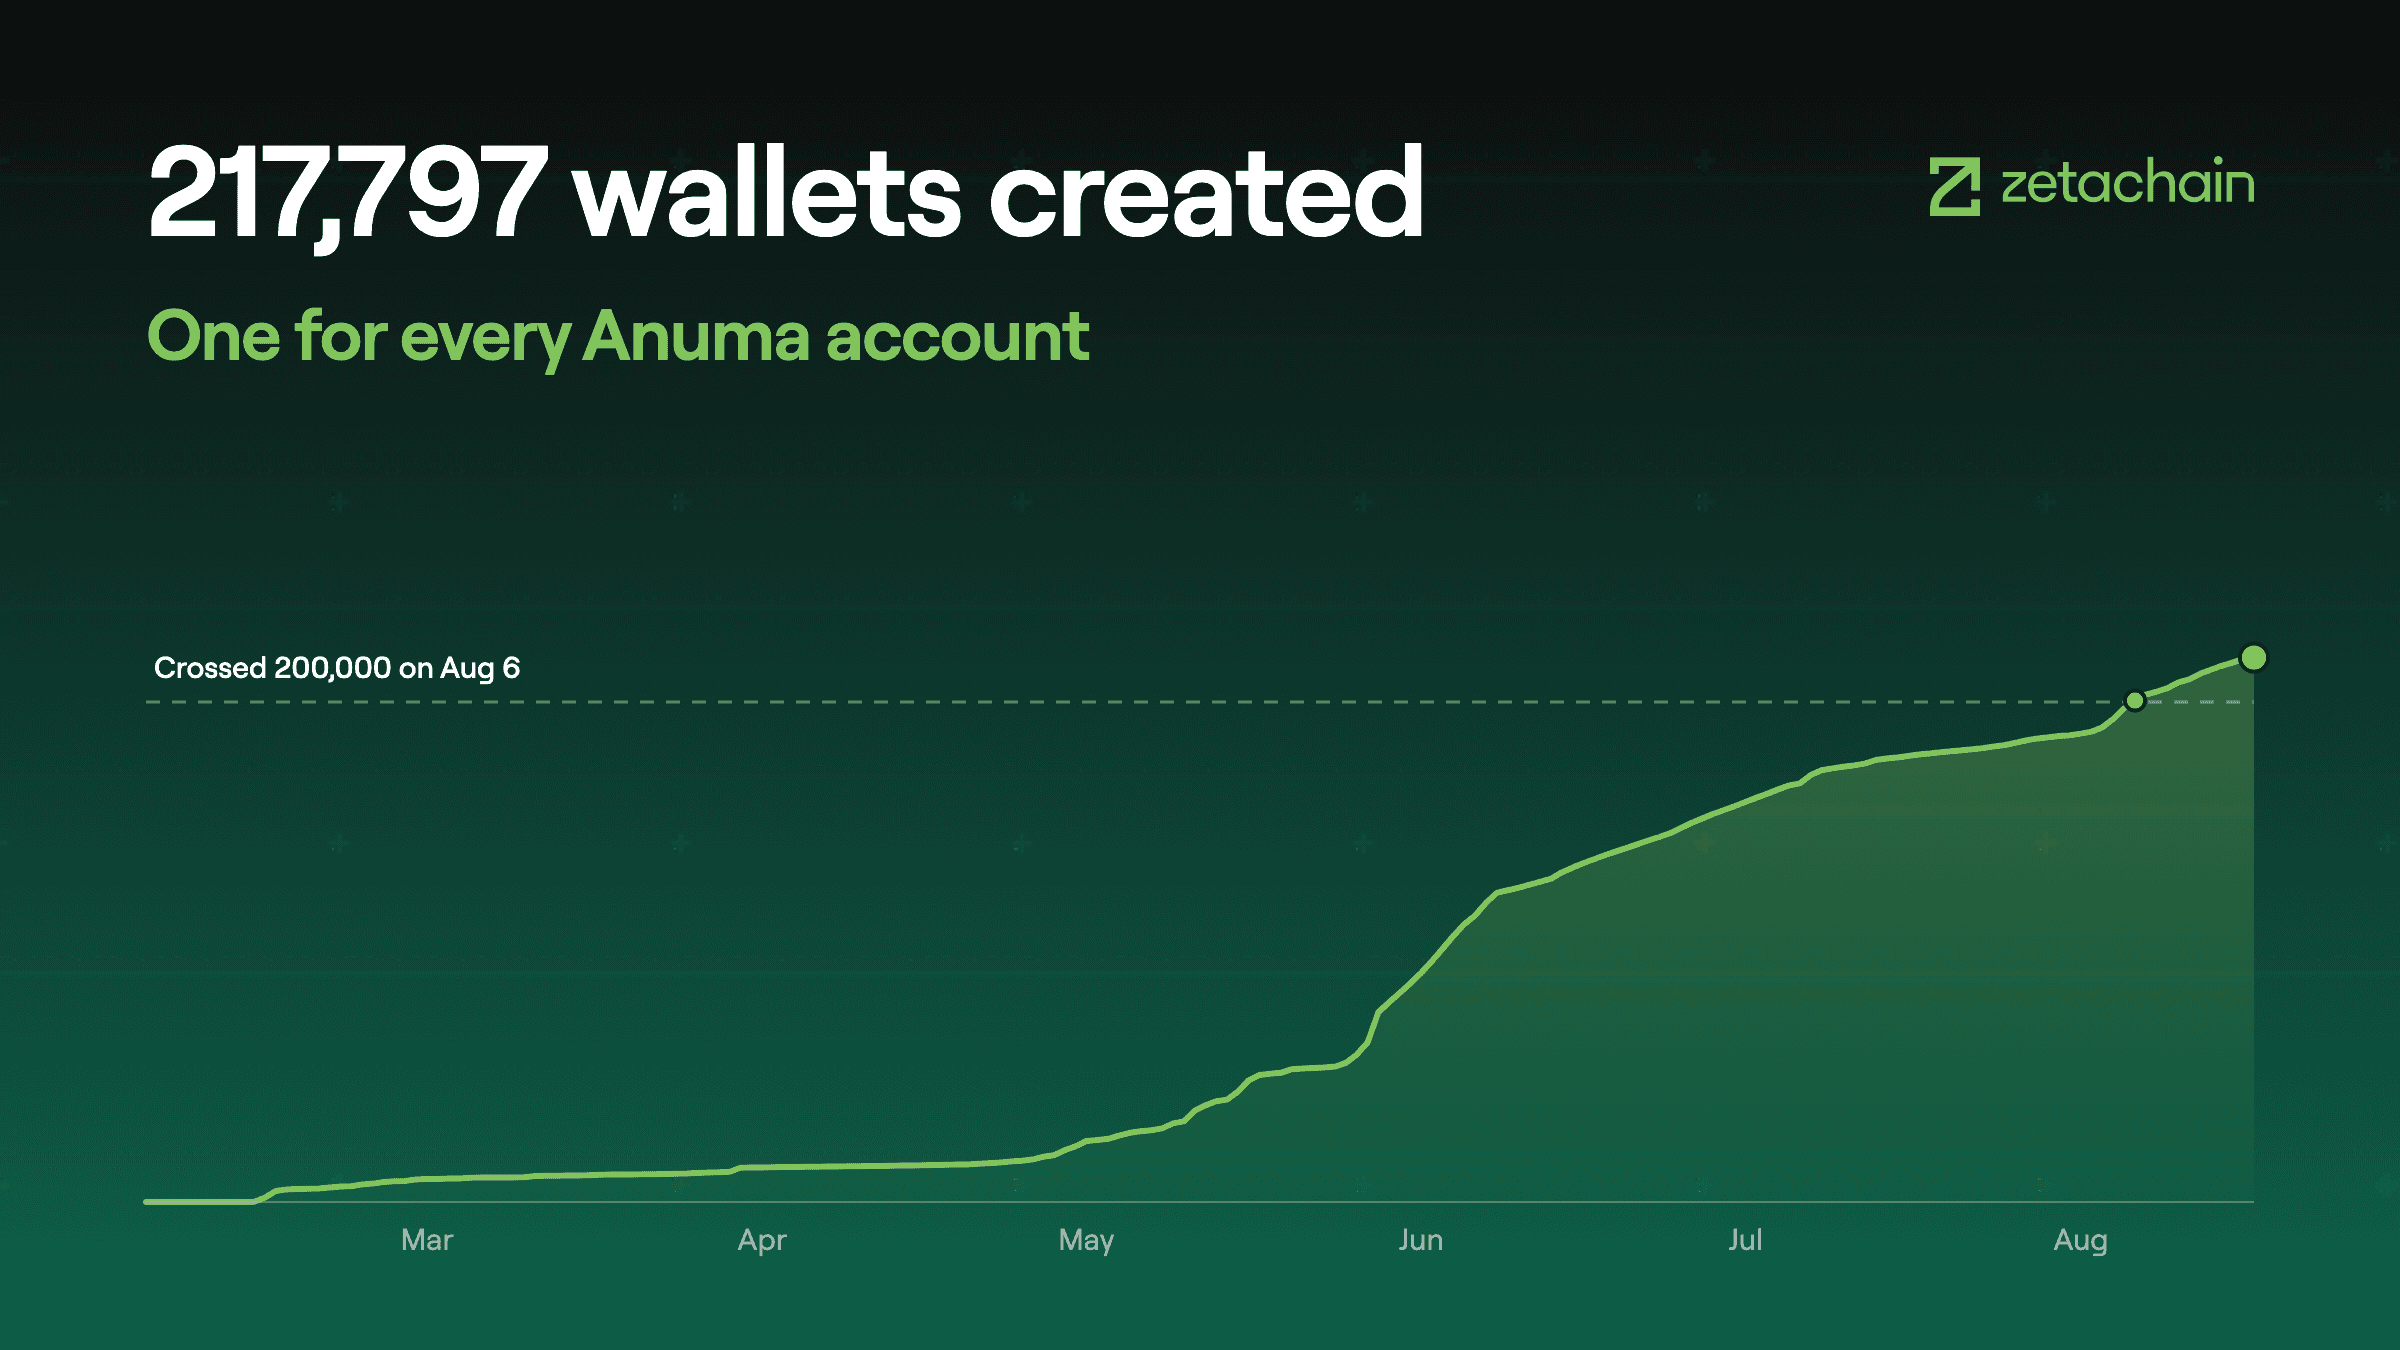
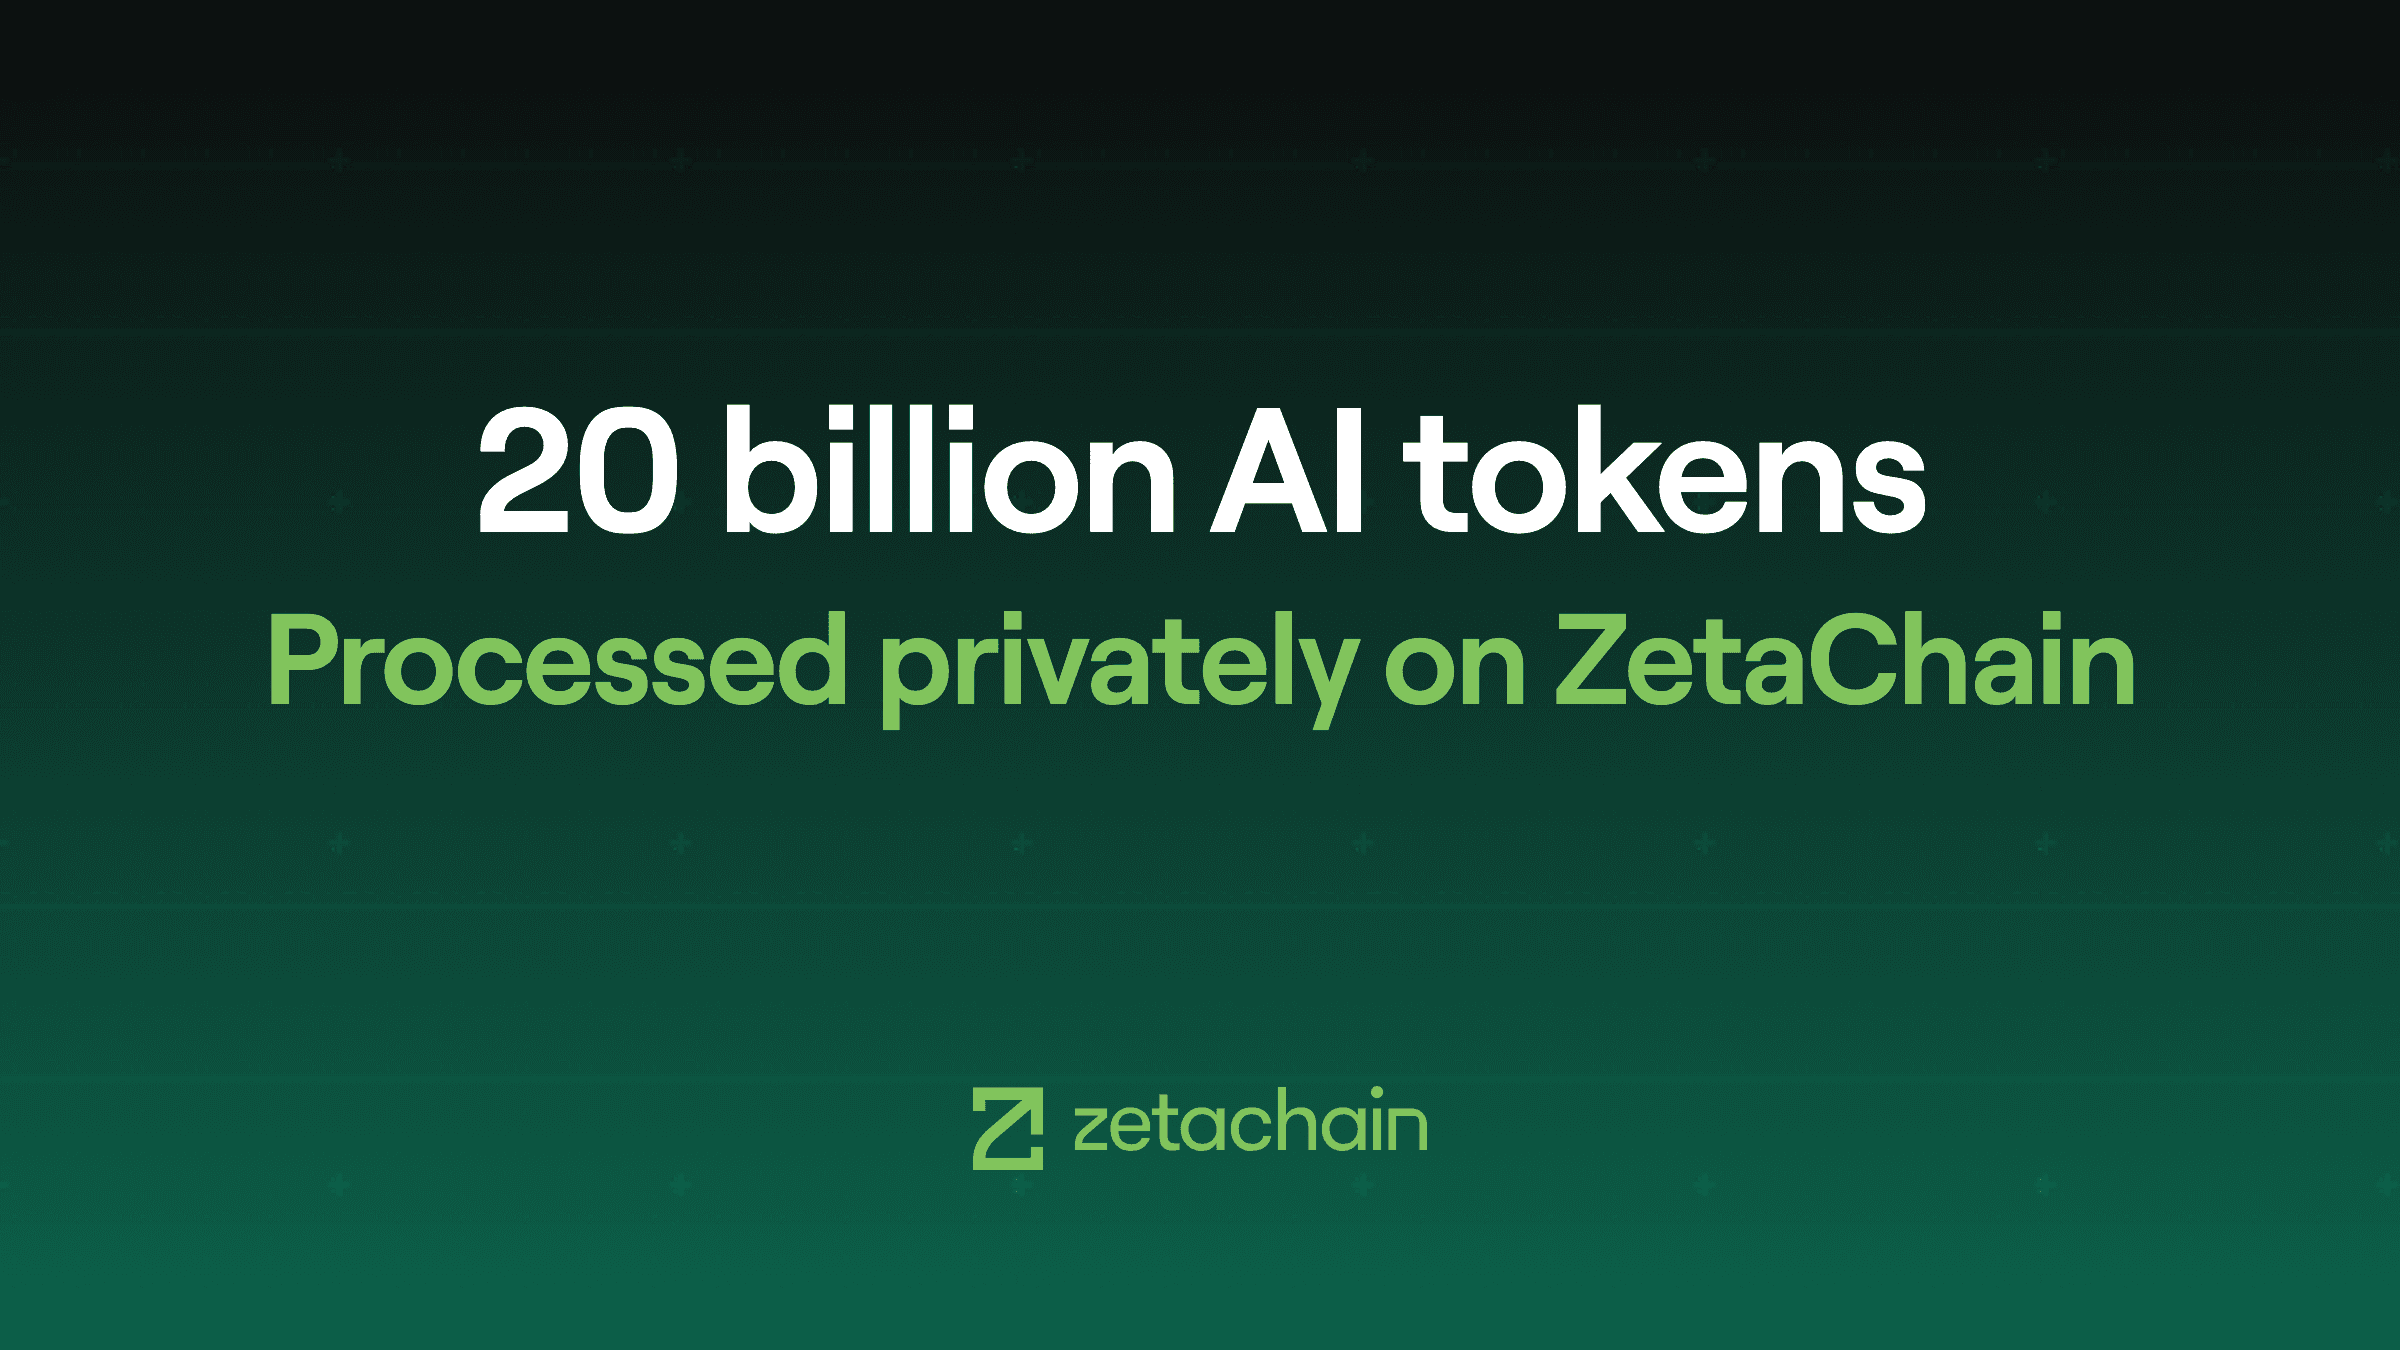
321,302 wallets have been created on the network, one for every person who joined Anuma, most of them people using their first crypto-powered product. The 200,000th wallet was created on August 6. July brought 28,312 new joins; August passed 31,101 by August 17 and is pacing to roughly double July. On August 17, lifetime throughput crossed twenty billion AI tokens (20,001,481,488, to be exact).
The first of ZETA’s six utilities is live: locking ZETA earns AI credits, and 100,000 locked ZETA unlocks Anuma Pro. Of the 2.1B total supply, 397.4M ZETA · 18.92% is staked on-chain. Staking rewards are computed live from on-chain emissions and the bonded pool, an annualized 9.1% at press time.
What we cannot tell you
How many memories the network holds. Memories are encrypted on your device; the server cannot count them, let alone read them. A privacy-safe aggregate counter is under consideration. Until then, the absence of this number is the clearest proof the architecture works as designed.
Methodology and limitations
Requests mean model inference; the embedding operations behind memory recall roughly triple total network traffic and are excluded throughout. Usage shares cover the trailing 90 days unless stated. Intelligence Index scores are Artificial Analysis’s published leaderboard as of August 17, 2026, using the high reasoning tier where multiple tiers are listed; models without a published score, including gpt-5.4, claude-sonnet-4.6, gpt-oss-120b, and nova-2-lite, are excluded from the scatter, as is the qwen-3.6 family, whose dominant variant here is unscored. Deliberate picks are messages where the user selected a specific model rather than auto, about 15 percent of messages. Developer shares are computed from OpenRouter’s public leaderboard, week through August 16, 2026, as each model’s share of top-10 tokens; model versions that differ across the two markets are excluded from the comparison. Our population skews privacy-motivated and multi-model by construction; treat absolute levels accordingly and watch the deltas edition over edition. The scatter’s usage axis is log scale.
Next edition
The three indices above, and the developer-versus-consumer comparison, are tracked every edition. Future editions will add model retention cohorts and the roadmap utilities, per-request settlement via x402 and creator incentives among them, as they move from design to live.